Awesome graphs and statistics with Drupal and gRaphaël

Awesome graphs and statistics with Drupal and gRaphaël
Day:
Tuesday, 24. august 2010
Time:
17:15-18:00
45 minutes (+15 minutes Q&A)
Room:
tags
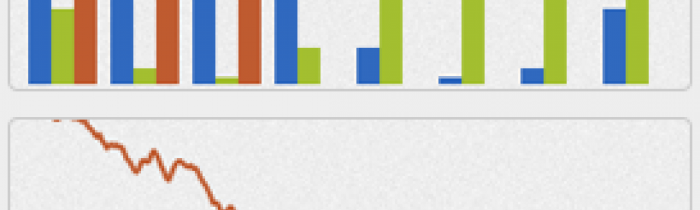
With Drupal-sites, you’re often sitting on a mountain of interesting data. I will go through some of the tools and methods you can use to present those data to your users in interesting and appealing ways.
Using the gRaphaël JavaScript library, and with the combined forces of Drupals API, SQL, caching and statistics, I will give an introduction to how you can make your site more appealing to data explorers.
Very interested in this one.
Very interested in this one.
Cool topic. I love open data
Cool topic. I love open data and I hope I can get nice pointers about data presentation from this talk.